Knowledge Resource
The Industry Standard for Pipeline Engineering Calculations for Over 20 Years
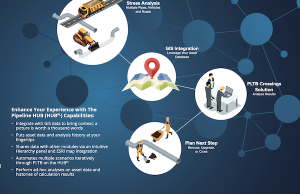
Crossings Workflow Overview Infographic
The Crossings Workflow Overview provides high-level insight into the Crossing Workflow module’s capabilities. In images and bullet points, it demonstrates how this tool analyzes pipeline crossing stresses. After reading the Crossings Workflow Overview, you will understand how it accelerates calculations involving multiple pieces of equipment and multiple pipelines simultaneously.
The module helps you analyze crossing requests faster and more accurately. It handles variations in depth, soils, types of pipe, as well as installation types and backfill options in seconds. The infographic shows you how the design of this module allows multiple scenarios to run without repetitive manual input by automating iterations through PLTB on the HUBPL. It becomes clear how users can further leverage the power of the HUBPL‘s integrated data environment. It achieves this by leveraging its asset database of pipe characteristics via the ESRI map integration or the intuitive Hierarchy panel.
Analyzing pipeline crossings is one of the most demanding tasks that operators face daily. On paper, it’s a simple process of measuring stresses on a pipe. In the real world, it’s never that easy, with more than one, possibly dozens of pipes under the crossing. Making the determinations can be time-consuming, but if you cut corners, it opens the door to more risks.
The Crossings Workflow Overview infographic shows you how the module’s tools transform your capabilities and the scope of the benefits. The format is accessible to engineers and non-engineers alike. Download it today and see for yourself how the module can help you!

The Crossings Workflow Overview tells you:
- The multiplicity of what the module gains and saves
- The ways it mitigates the risks that lead to accidents or damage
- The advantages when you face audits and legal challenges
- Why it makes collaborating more manageable and productive
- What other tools integrate with the module
- And much more!
